
Constructing Human Mobility Tensor on NYC Rideshare Trip Data
Among a large number of open human mobility datasets, TLC trip record data might be one of the most classical sources for doing mobility research and data analysis. This open data includes yellow and green taxi trip records, For-Hire Vehicle (FHV) trip records, and High Volume For-Hire Vehicle (HVFHV) trip records stored in the .parquet format, ranging from 2009 to the latest date. The HVFHV trip records have TLC license numbers for Juno (HV0002), Uber (HV0003), Via (HV0004), and Lyft (HV0005), see data dictionary for details. In what follows, we use rideshare trip records to mention the HVFHV trip records instead.
Rideshare Trip Records
The first procedure is downloading the rideshare trip records from TLC trip record data through selecting certain data files, e.g., High Volume For-Hire Vehicle (HVFHV) trip records in April and May in 2024:
fhvhv_tripdata_2024-04.parquet(April 2024, with 476.1 MB)fhvhv_tripdata_2024-05.parquet(May 2024, with 498.6 MB)
These data files in the format of .parquet can be easily processed by pandas in Python.
import pandas as pd
import glob

df = pd.concat([pd.read_parquet(file) for file in glob.glob('NYC-rideshare/fhvhv_tripdata_2024-*.parquet')])
df.head()
As a result, the output is
hvfhs_license_num	dispatching_base_num	originating_base_num	request_datetime	on_scene_datetime	pickup_datetime	dropoff_datetime	PULocationID	DOLocationID	trip_miles	...	sales_tax	congestion_surcharge	airport_fee	tips	driver_pay	shared_request_flag	shared_match_flag	access_a_ride_flag	wav_request_flag	wav_match_flag
0	HV0003	B03404	B03404	2024-04-30 23:55:50	2024-04-30 23:59:00	2024-05-01 00:00:36	2024-05-01 00:38:21	138	21	18.680	...	4.48	0.00	2.5	0.00	47.41	N	N	N	N	N
1	HV0003	B03404	B03404	2024-05-01 00:41:32	2024-05-01 00:47:40	2024-05-01 00:49:40	2024-05-01 00:57:08	21	22	1.710	...	1.03	0.00	0.0	0.00	6.69	N	N	N	N	N
2	HV0003	B03404	B03404	2024-05-01 00:09:01	2024-05-01 00:10:51	2024-05-01 00:11:31	2024-05-01 00:33:51	140	129	5.000	...	2.65	0.75	0.0	0.00	19.82	Y	N	N	N	N
3	HV0003	B03404	B03404	2024-05-01 00:25:43	2024-05-01 00:48:00	2024-05-01 00:48:30	2024-05-01 01:10:17	138	48	9.250	...	3.47	2.75	2.5	0.00	25.28	N	N	N	N	N
4	HV0005	B03406	None	2024-05-01 00:00:08	NaT	2024-05-01 00:09:29	2024-05-01 00:28:51	4	25	4.996	...	2.38	2.75	0.0	6.99	22.24	N	N	N	N	Y
5 rows × 24 columns
To construct human mobility tensors, the columns we are interested are pickup_datetime (starting time), PULocationID (pickup location ID), and DOLocationID (dropoff location ID). Therefore, we generate a new dataframe as follows.
data = pd.DataFrame()
data['pickup_datetime'] = df['pickup_datetime']
data['PULocationID'] = df['PULocationID']
data['DOLocationID'] = df['DOLocationID']
data['month'] =  data['pickup_datetime'].dt.month
data['day'] = data['pickup_datetime'].dt.day
data['hour'] = data['pickup_datetime'].dt.hour
data
As a result, the output is
pickup_datetime	PULocationID	DOLocationID	month	day	hour
0	2024-05-01 00:00:36	138	21	5	1	0
1	2024-05-01 00:49:40	21	22	5	1	0
2	2024-05-01 00:11:31	140	129	5	1	0
3	2024-05-01 00:48:30	138	48	5	1	0
4	2024-05-01 00:09:29	4	25	5	1	0
...	...	...	...	...	...	...
19733033	2024-04-30 23:34:35	76	38	4	30	23
19733034	2024-04-30 23:14:38	126	126	4	30	23
19733035	2024-04-30 23:33:36	126	32	4	30	23
19733036	2024-04-30 23:53:58	32	31	4	30	23
19733037	2024-04-30 23:08:31	50	7	4	30	23
40437576 rows × 6 columns
The number of rideshare trip records in April and May 2024 is 40,437,576 in total. The maximum pickup and dropoff location ID is 265, but in fact, there are 262 unique pickup/dropoff location IDs. As mentioned above, one can extract month, day, and hour information from the pickup datetime.
Constructing Mobility Tensor
According to the pickup location ID, dropoff location ID, and time step with an hourly time resolution, one can construct a mobility tensor with (origin, destination, time) dimensions, while the entries of this tensor are trip counts.
data = data.groupby(['PULocationID', 'DOLocationID', 'month', 'day',
                     'hour']).size().reset_index(name = 'count')
data
As a result, the output is
PULocationID	DOLocationID	month	day	hour	count
0	1	1	4	15	5	1
1	1	1	5	5	6	1
2	2	2	4	19	18	1
3	2	7	4	20	13	1
4	2	10	5	21	22	1
...	...	...	...	...	...	...
14167210	265	265	5	31	10	1
14167211	265	265	5	31	11	1
14167212	265	265	5	31	13	2
14167213	265	265	5	31	14	1
14167214	265	265	5	31	20	1
14167215 rows × 6 columns
By doing so, one can work on the aggregated data to construct a tensor of size , and there are
hourly time steps. The
time_step column are computed as follows.
import numpy as np

n = len(data)
a = np.zeros(n)
for i in range(n):
    if data['month'][i] == 4:
        a[i] = 24 * (data['day'][i] - 1) + data['hour'][i]
    elif data['month'][i] == 5:
        a[i] = 30 * 24 + 24 * (data['day'][i] - 1) + data['hour'][i]
data['time_step'] = a
The resultant tensor is saved as NYC_mob_tensor.npz (18.6 MB, available at visual-spatial-data on GitHub) in the compressed form.
m = int(pd.unique(data['PULocationID']).max())
t = 24 * 61
tensor = np.zeros((m, m, t))
for i in range(len(data)):
    tensor[int(data['PULocationID'][i]) - 1, int(data['DOLocationID'][i]) - 1, int(data['time_step'][i])] = data['count'][i]
np.savez_compressed('NYC_mob_tensor.npz', tensor)
Visualizing Rideshare Trips
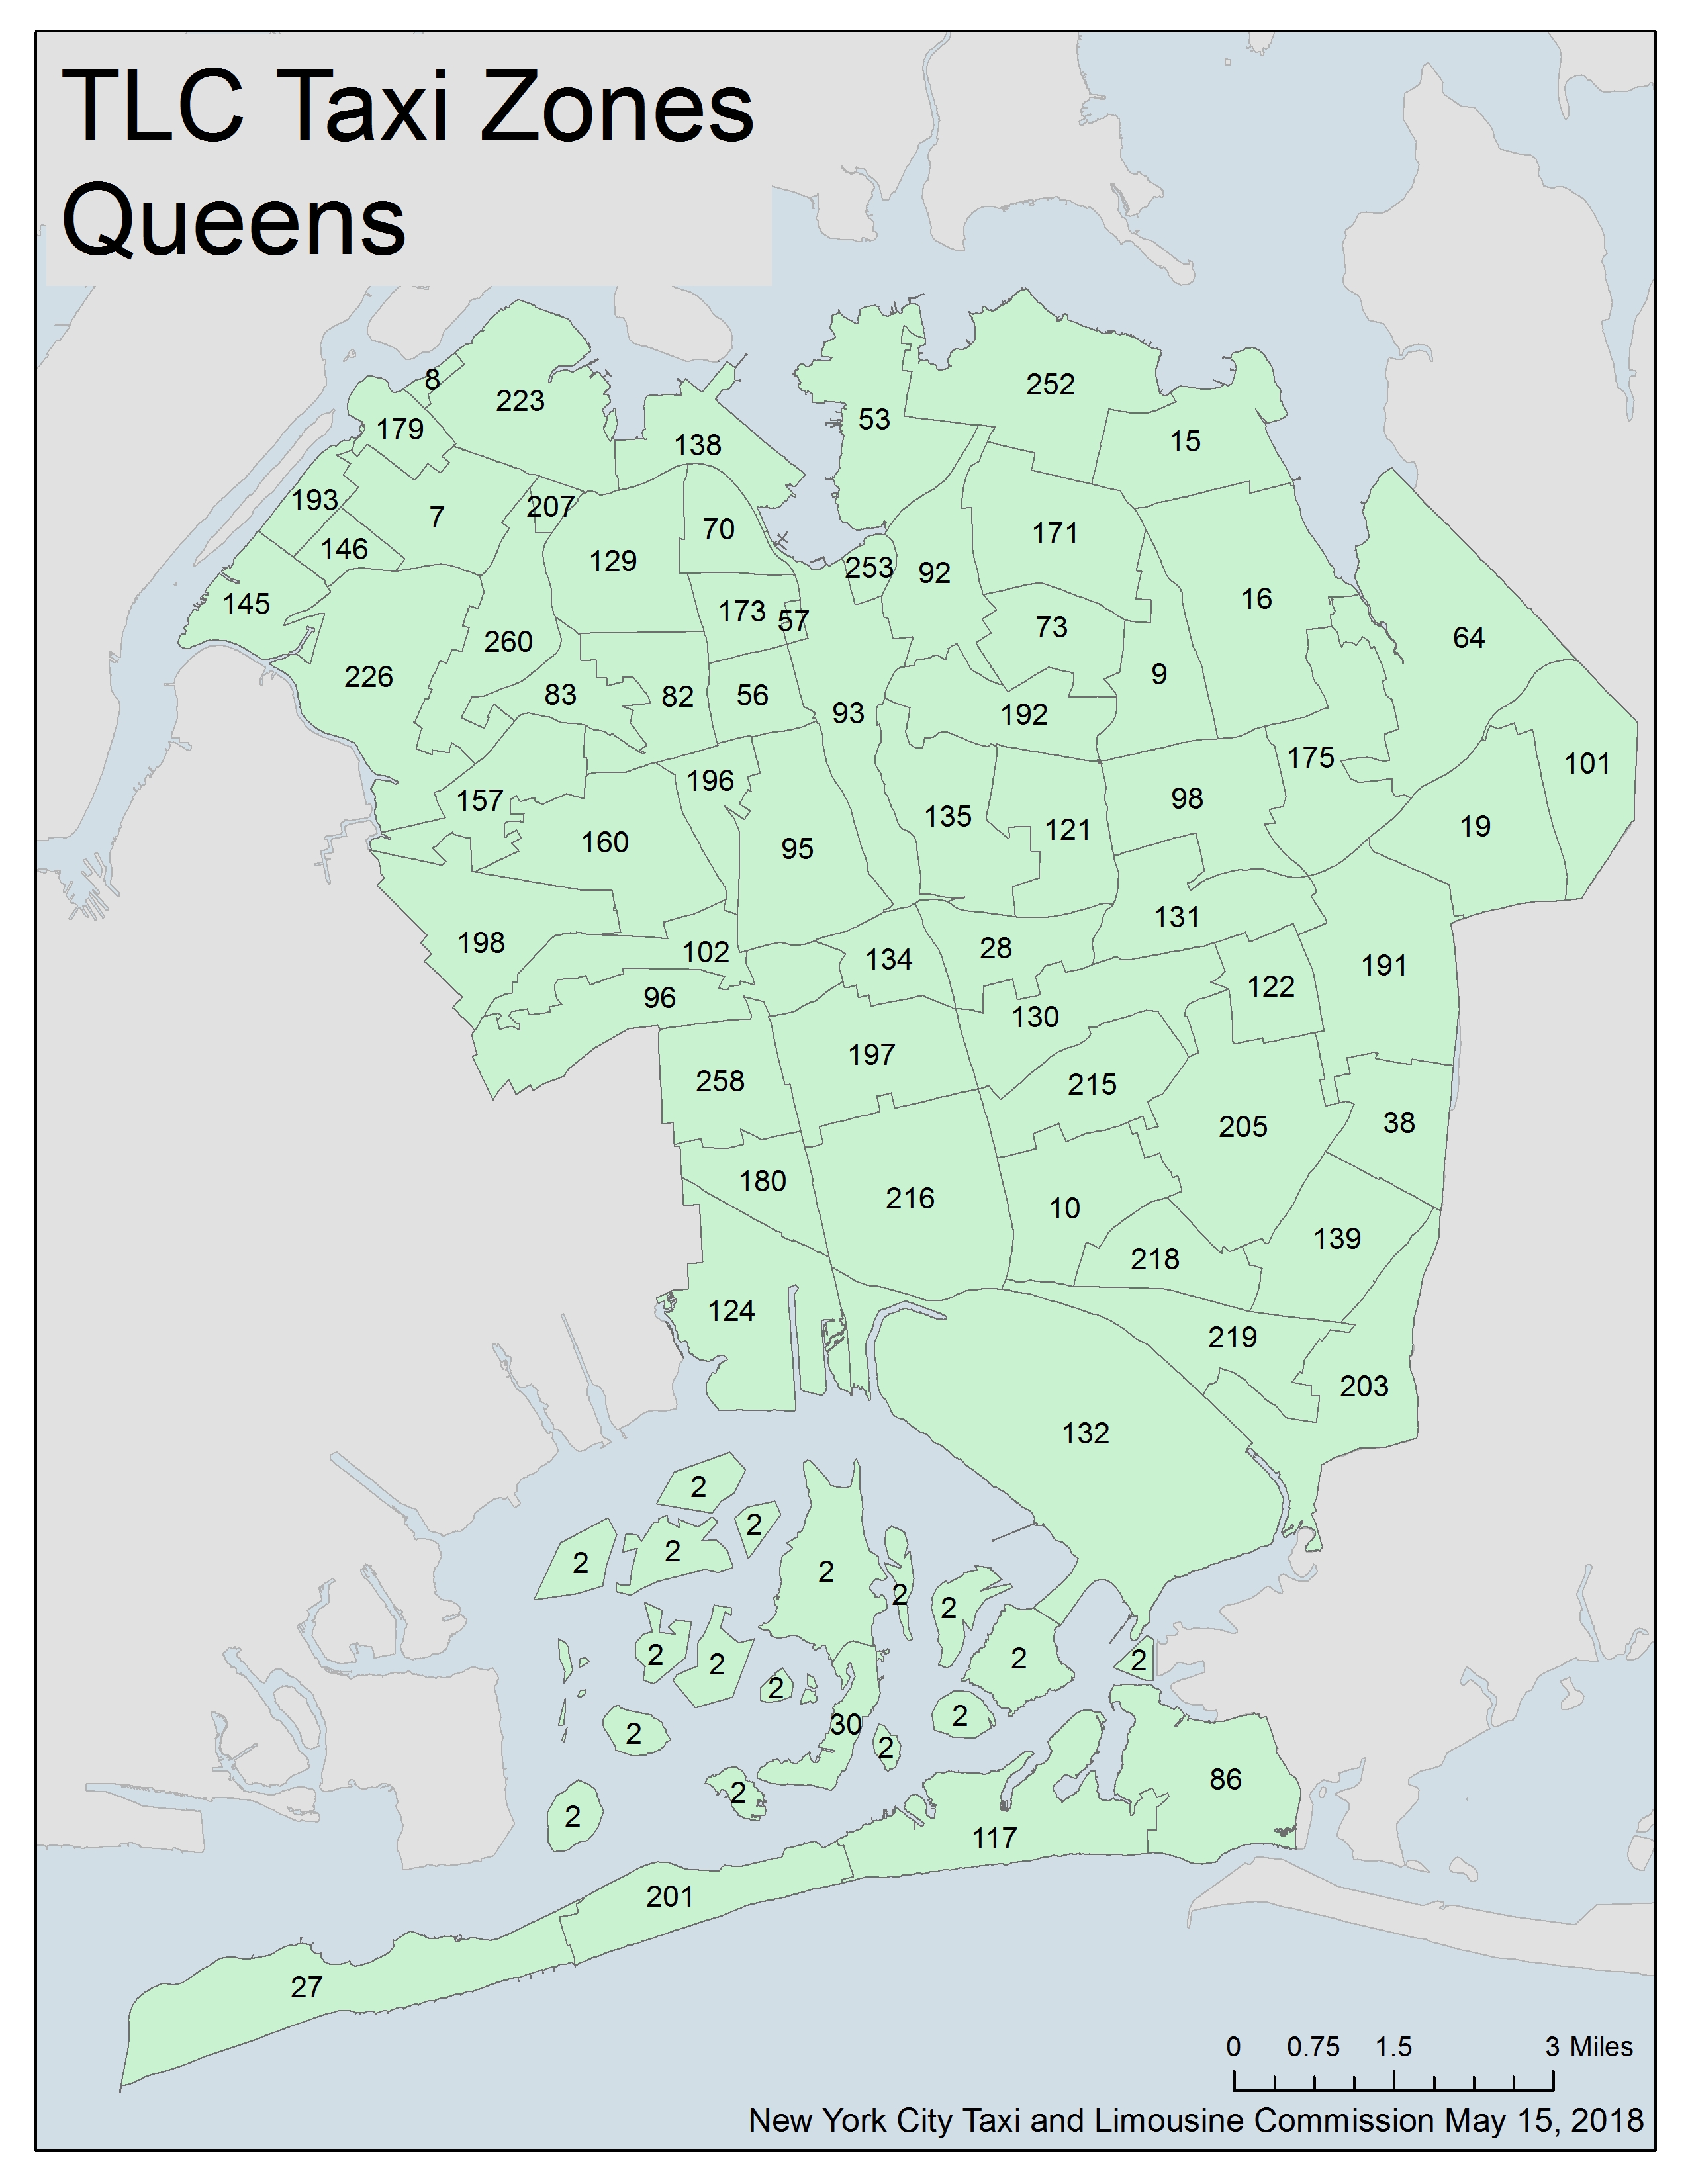
The number of taxi zones is 262, and the shapefile is available at Taxi Zone Shapefile (.parquet) (or check out the visual-spatial-data repository on GitHub). Figure 1 shows the spatial distributions of daily pickup and dropoff trips. As can be seen, two siginificant taxi zones outside Manhattan—John F. Kennedy International Airport (area #132 in Queens taxi zones) and LaGuardia Airport (area #138 in Queens taxi zones)—are airports in New York City.
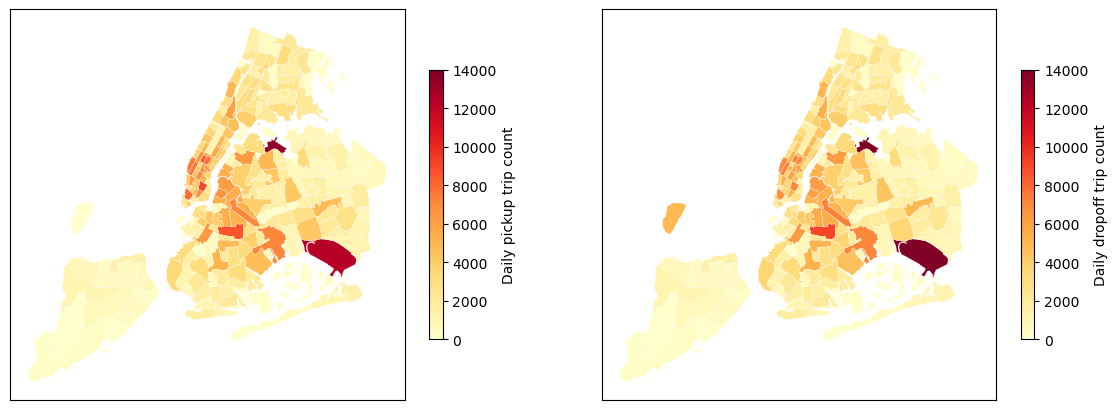
Figure 1. Daily rideshare pickup and dropoff trips during the first 8 weeks since April 1, 2024 in New York City, USA. There are 37,404,265 trips in total, while the average daily trips are 667,933.
import pandas as pd
import geopandas as gpd
import matplotlib.pyplot as plt

nyc = gpd.read_file('taxi_zones/taxi_zones.shp')
nyc['LocationID'] = nyc['LocationID'].astype(int)
tensor = np.load('NYC_mob_tensor.npz')['arr_0'][:, :, : 8 * 7 * 24]
df_count = pd.DataFrame()
df_count['LocationID'] = np.arange(1, tensor.shape[0] + 1)

fig = plt.figure(figsize = (14, 7))
for i in [1, 2]:
    ax = fig.add_subplot(1, 2, i)
    if i == 1:
        df_count['count'] = np.sum(np.sum(tensor, axis = 2), axis = 1) / 56
        gdf_count = nyc.set_index('LocationID').join(df_count.set_index('LocationID')).reset_index()
        gdf_count.plot('count', cmap = 'YlOrRd', legend = True, edgecolor = 'white', linewidth = 0.2,
                       legend_kwds = {'shrink': 0.5, 'label': 'Daily pickup trip count'},
                       vmin = 0, vmax = 1.4e+4, ax = ax)
    elif i == 2:
        df_count['count'] = np.sum(np.sum(tensor, axis = 2), axis = 0) / 56
        gdf_count = nyc.set_index('LocationID').join(df_count.set_index('LocationID')).reset_index()
        gdf_count.plot('count', cmap = 'YlOrRd', legend = True, edgecolor = 'white', linewidth = 0.2,
                       legend_kwds = {'shrink': 0.5, 'label': 'Daily dropoff trip count'},
                       vmin = 0, vmax = 1.4e+4, ax = ax)
    plt.xticks([])
    plt.yticks([])
plt.show()
fig.savefig('pickup_dropoff_trips_nyc_2024_april_may.png', bbox_inches = 'tight')
References
- Xinyu Chen. NYC taxi data processing. Blog post.
- Xinyu Chen, Chengyuan Zhang, Xiaoxu Chen, Nicolas Saunier, Lijun Sun (2024). Discovering dynamic patterns from spatiotemporal data with time-varying low-rank autoregression. IEEE Transactions on Knowledge and Data Engineering. 36 (2): 504-517.
(Posted by Xinyu Chen on August 7, 2024.)