Awesome LaTeX Drawing
Drawing and generating academic graphics in LaTeX for visualization purposes in research. LaTeX always demonstrates several merits such as mathematical accuracy and code-driven design for reproducibility.
(Updated on April 22, 2025)
awesome-latex-drawing is a GitHub repository we created in 2019 for visualization purposes, which has gained 1,600 stars until now. We have maintained it with regular updates since its inception. Initially, our goal was to share the LaTeX code used to generate academic graphics in our publications. Personally, the two most notable advantages of LaTeX visualization that we highly value are mathematical accuracy and code-driven design for reproducibility.
LaTeX Visualization Examples
Example 1 (Normalizing a two-dimensional vector). For any vector , one can normalize it with
-norm (denoted by
). Formally, the
-norm of the vector
is defined as
, which is the square root of the sum of squared entries. Thus, we have the normalized vector as follows,
Figure 1 visualizes a certain vector and the corresponding normalized vector in a two-dimensional Cartesian coordinate system.
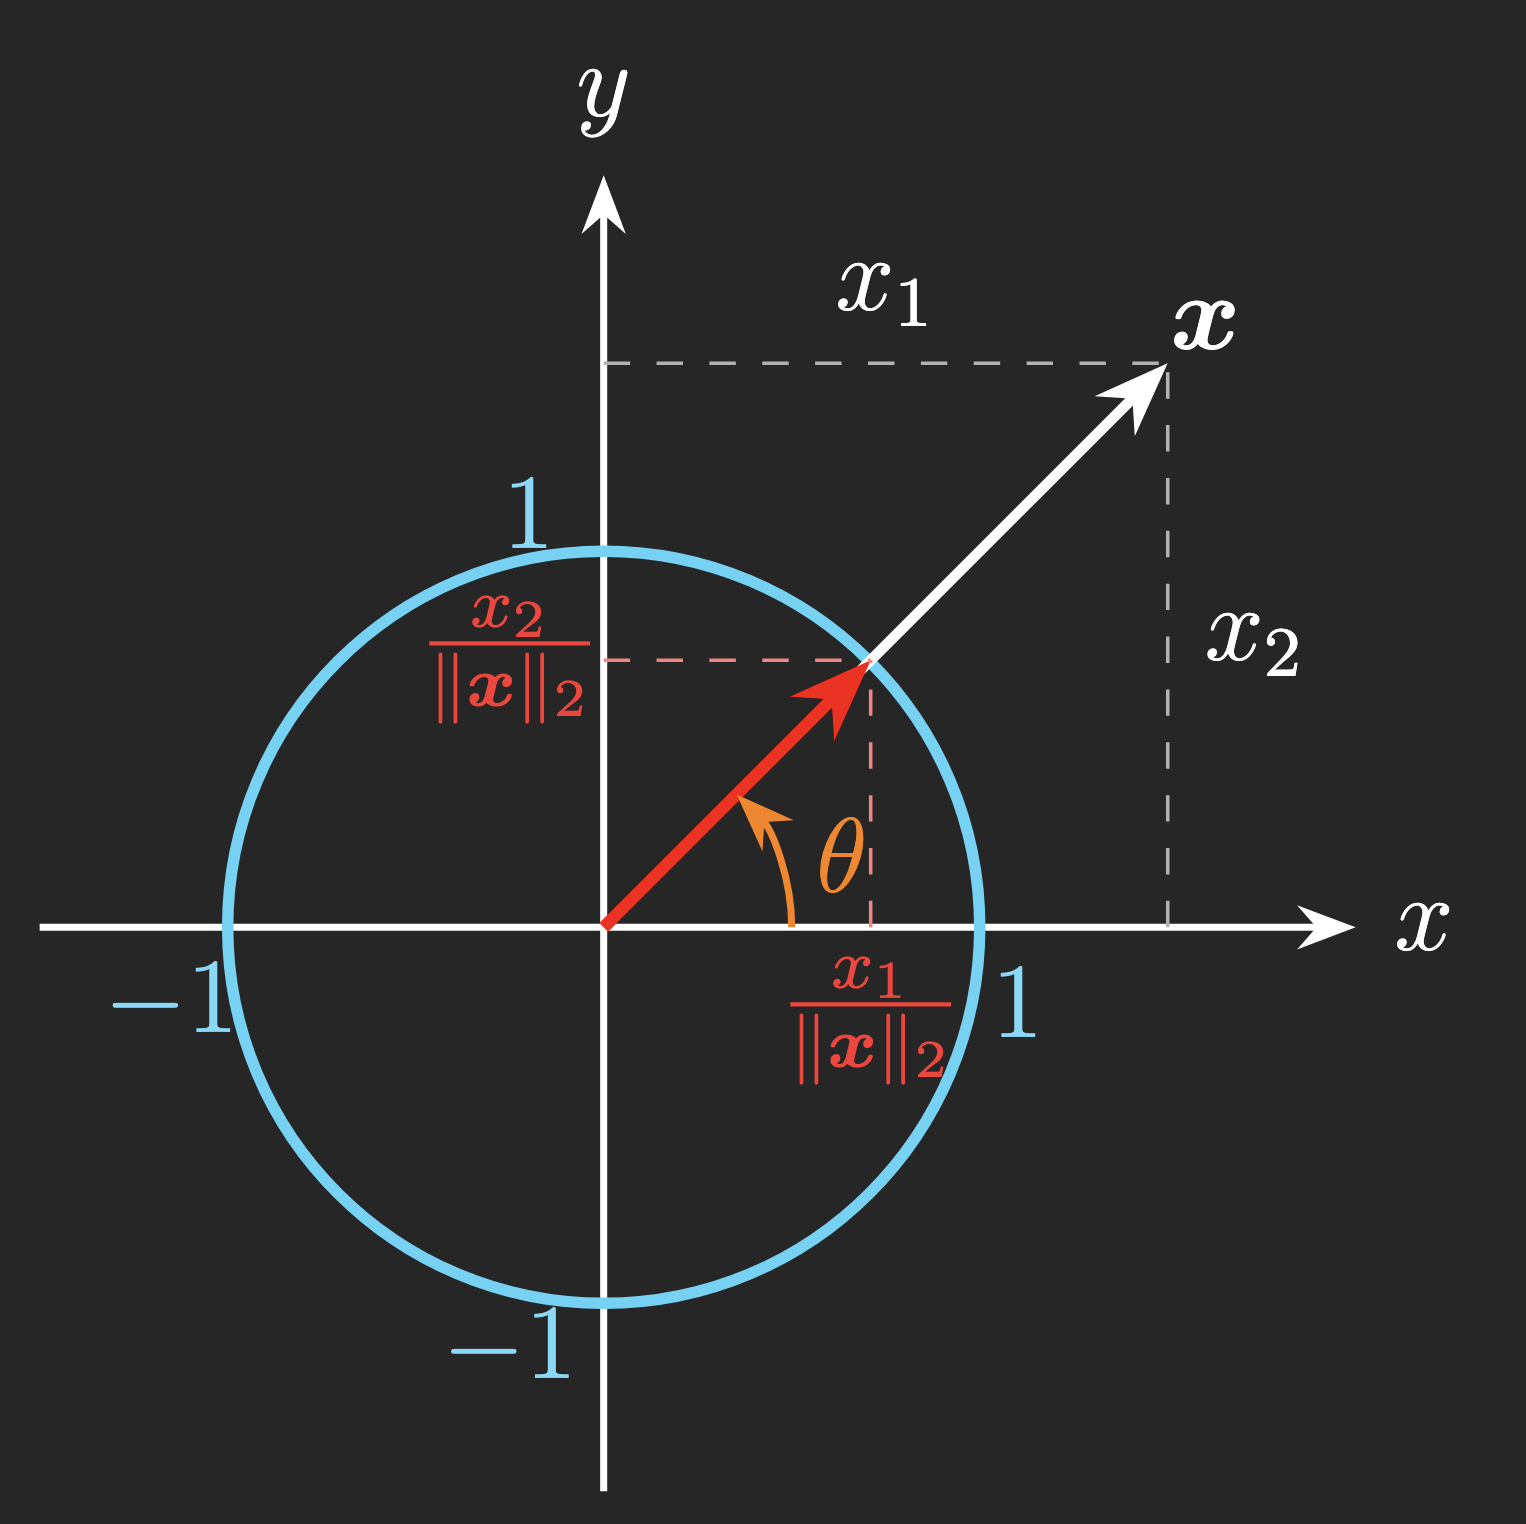
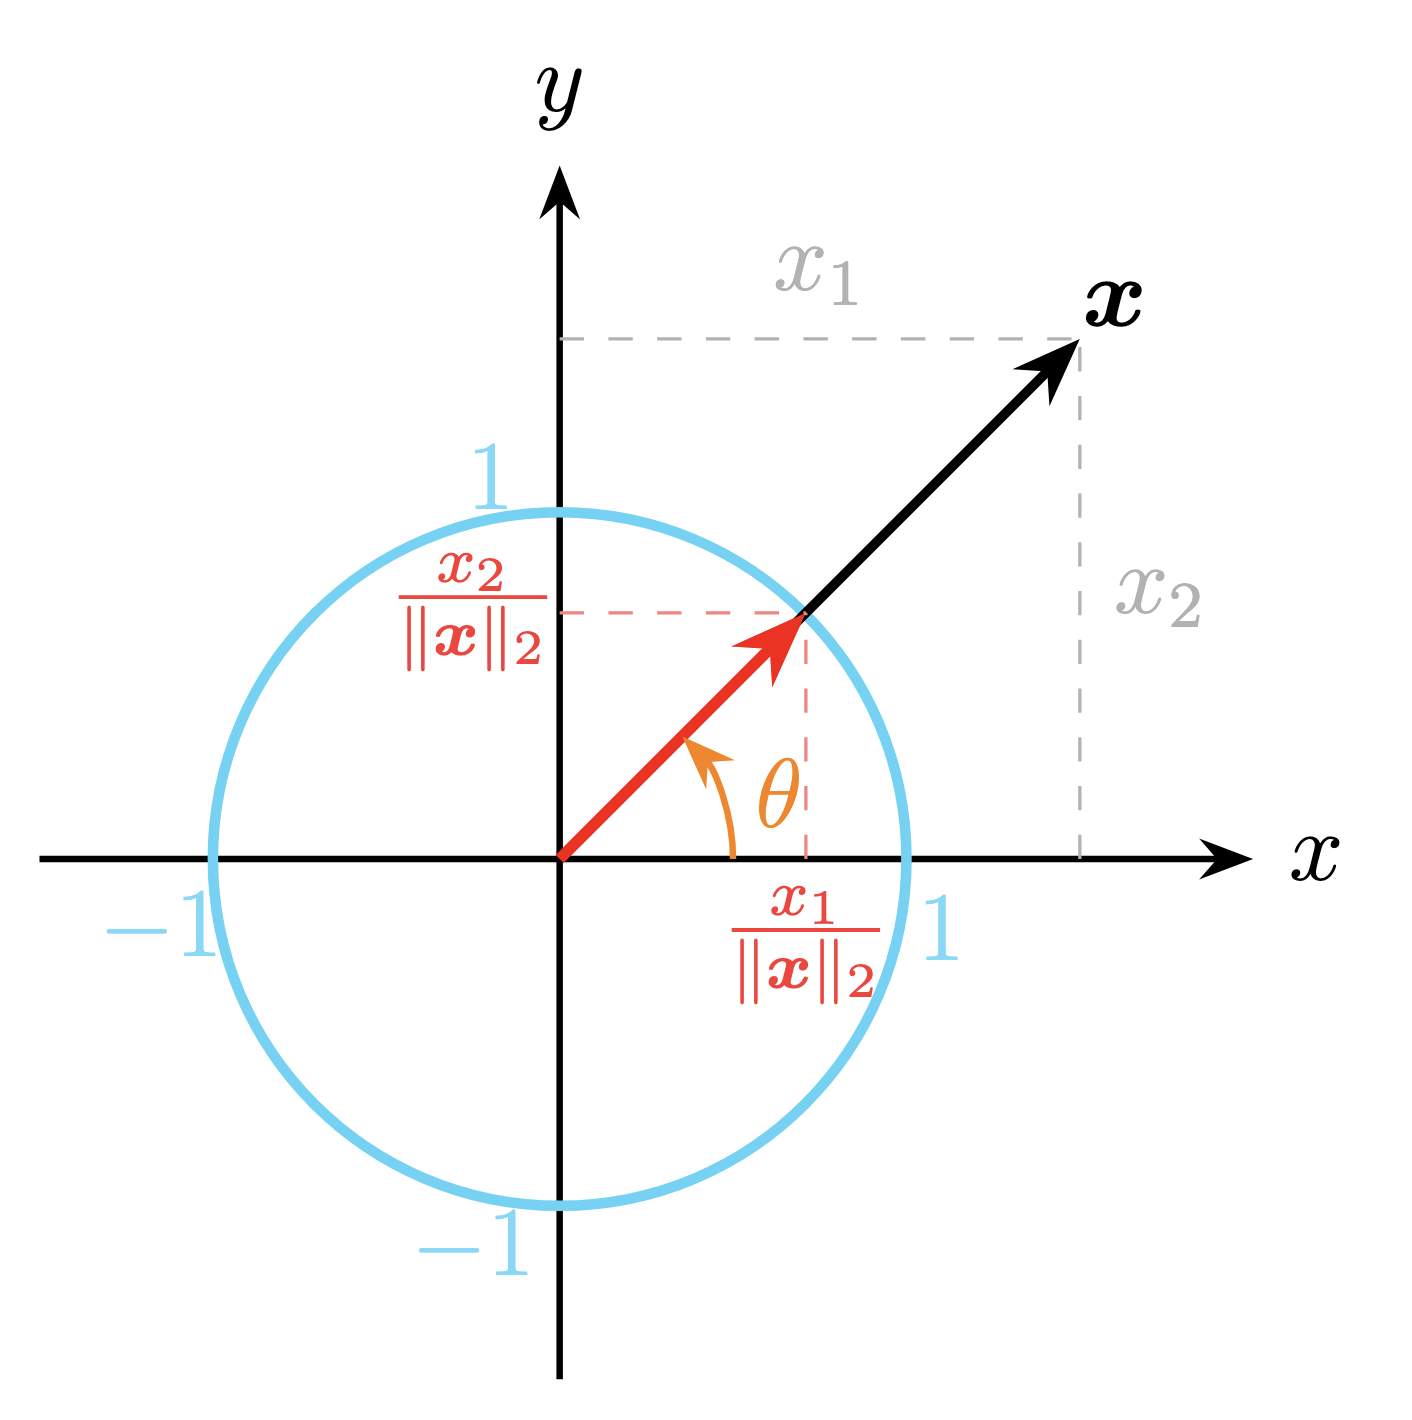
Figure 1. Illustration of normalized vectors in a certain direction, ensuring . (Left panel) Dark theme, see LaTeX code on GitHub. (Right panel) White theme, see LaTeX code on GitHub.
Example 2 (Manhattan distance). Manhattan distance (also known as taxicab distance) is a method for measuring the distance between two points in a grid-like space, similar to how a taxi would navigate through city streets. It is calculated by summing the absolute differences of the coordinates between the two points.
For any vector , the
-norm of vector
is defined as
which is the sum of the absolute values of entries. Figure 2 visualizes distance between the the point to
. This is equivalent to
-norm of vector such that
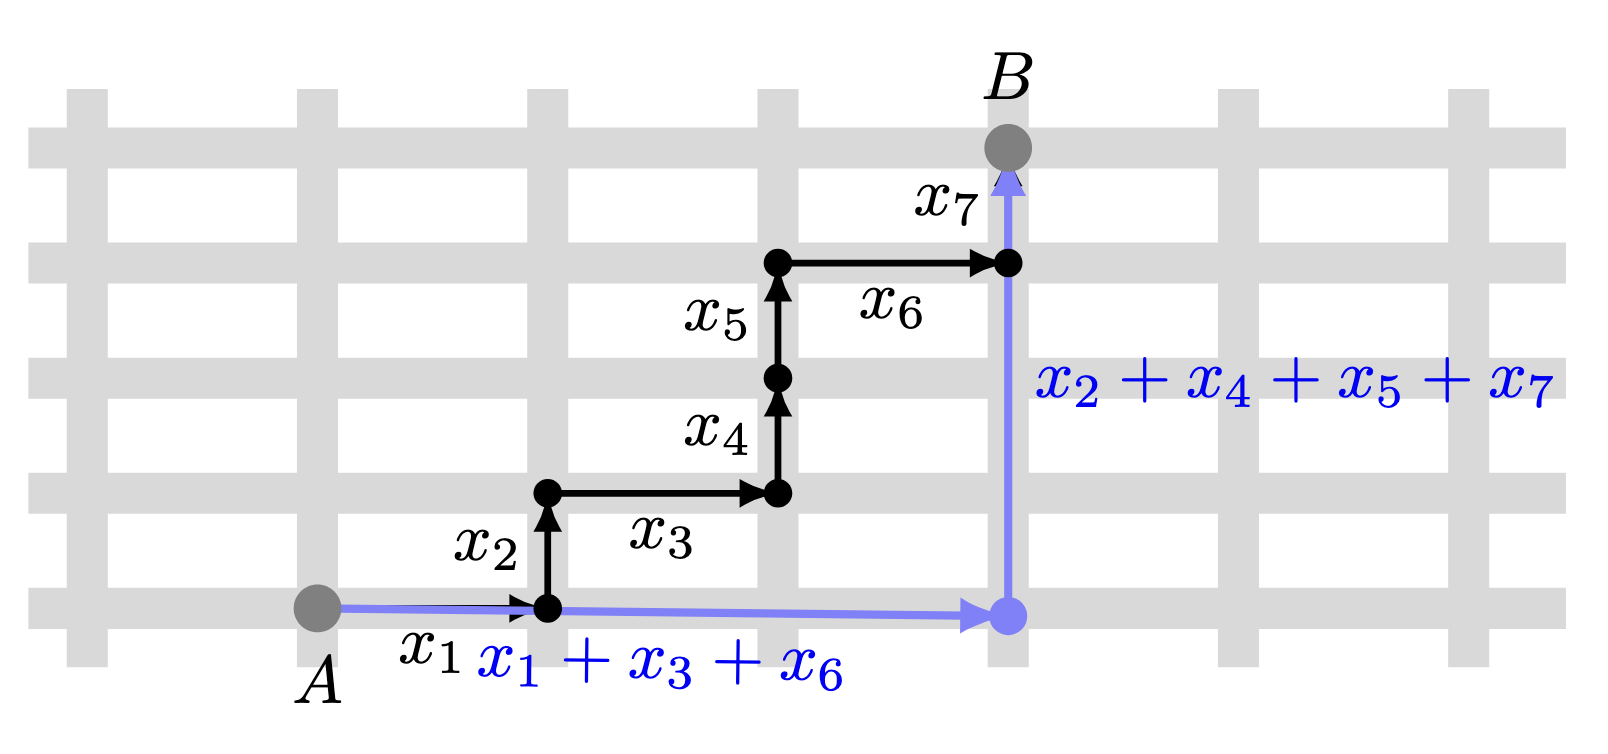
Figure 2. Illustration of Manhattan distance from the point to
with the distance vector
. See LaTeX code on GitHub.
Example 3 (Sine and cosine functions). Figure 3 illustrates four periodic waveforms consisting of sine and cosine functions with vertical offsets:
- Two sine functions
shifted upward by 0.75 and 0.25 units (cyan and blue curves, respectively).
- Two sine functions
shifted downward by 0.25 and 0.75 units (red and orange curves, respectively).
All functions share the same angular frequency , resulting in identical periods of oscillation. The vertical offsets demonstrate how constant terms affect the baseline of trigonometric waveforms while preserving their amplitude and phase relationships. The horizontal axis
ranges from 0 to 2, capturing two full cycles of each function.
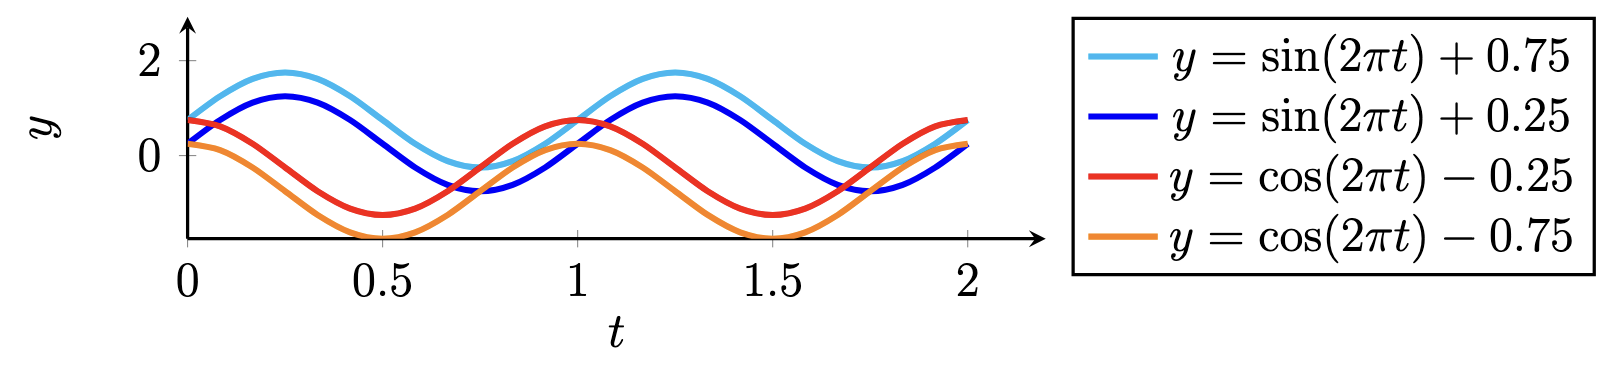
Figure 3. Illustration of four sequences consisting of sine and cosine functions. See LaTeX code on GitHub.
Example 4 (Two-step rolling time series prediction). For any time series snapshots , the two-step time series prediction scheme expects to estimate
. Notably, this example is from Figure 5, Chen et al., 2024.
Figure 4 shows the scheme of two-step rolling prediction, in which cyan and red circles refer to the observed values and predicted values, respectively.
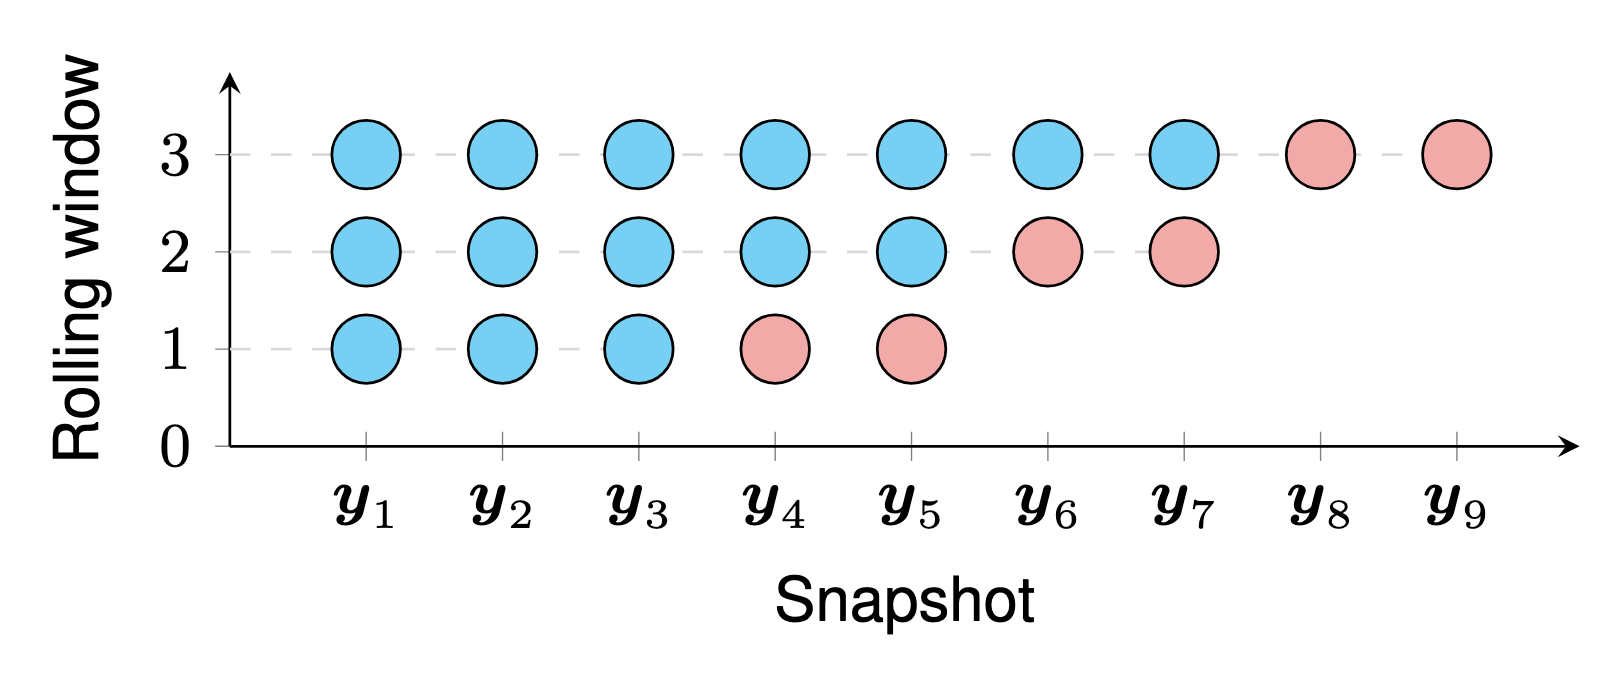
Figure 4. Illustration of rolling time series prediction. See LaTeX code on GitHub.
Example 5 (Time series forecasting with missing vlaues). For any time series snapshots with missing values, the task of forecasting the
steps ahead is very challenge. In our study, we propose temporal matrix factorization models and use it to learn from partially observed data and make prediction directly. The example we mentioned below is from Figure 1, Chen et al., 2024. Figure 5 shows the modeling process of forecasting
.
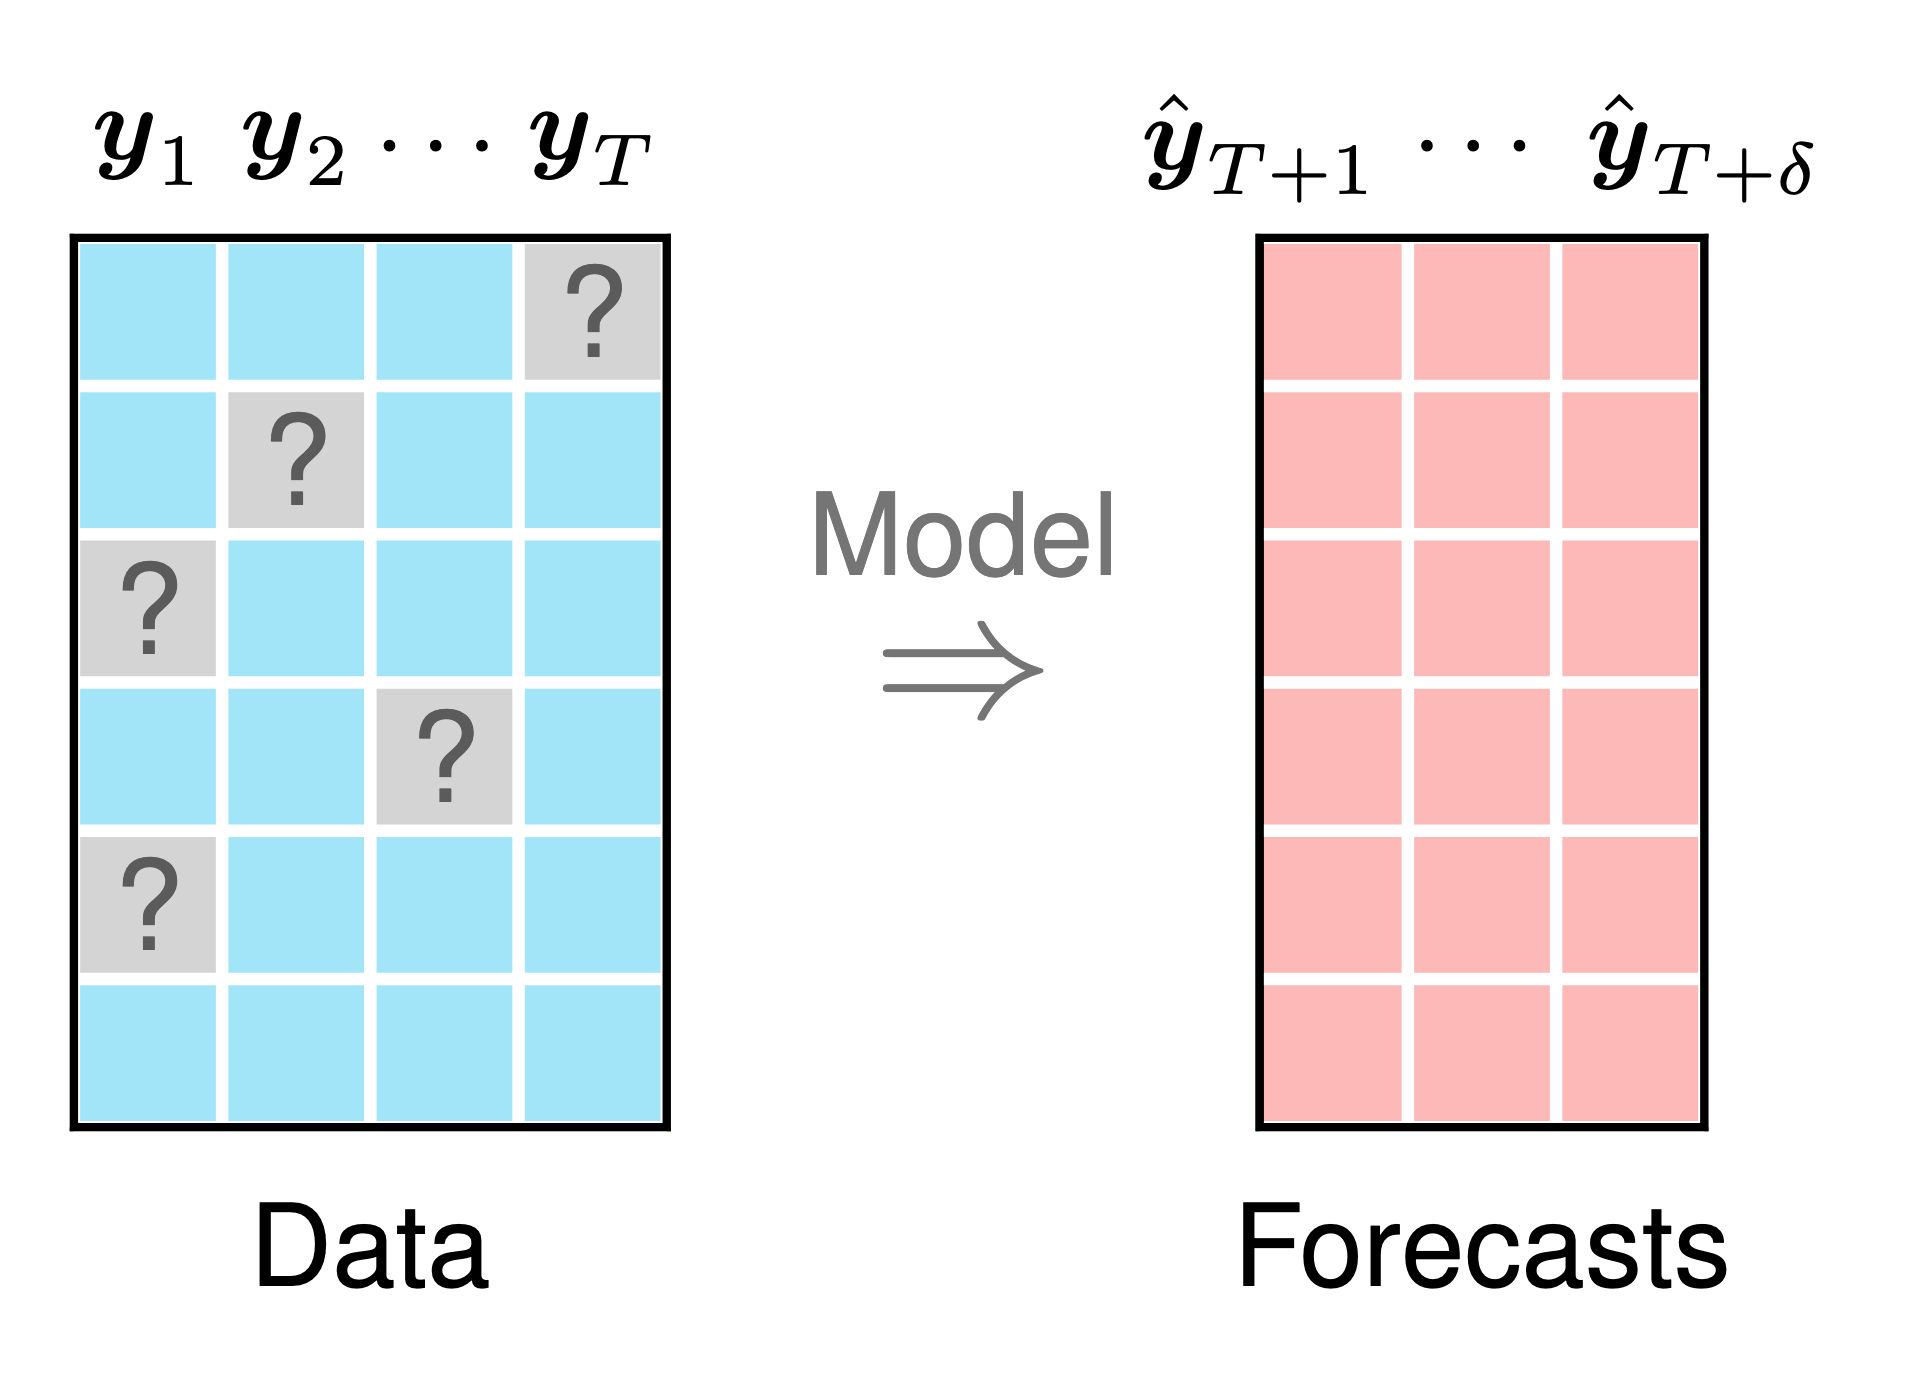
Figure 5. Illustration of time series forecasting with missing values. See LaTeX code on GitHub.
Example 6 (Third-order tensor). In tensor computations, third-order tensor of size can be denoted by
. Element-wise, the
-th entry of tensor
is written as
, see Figure 6.
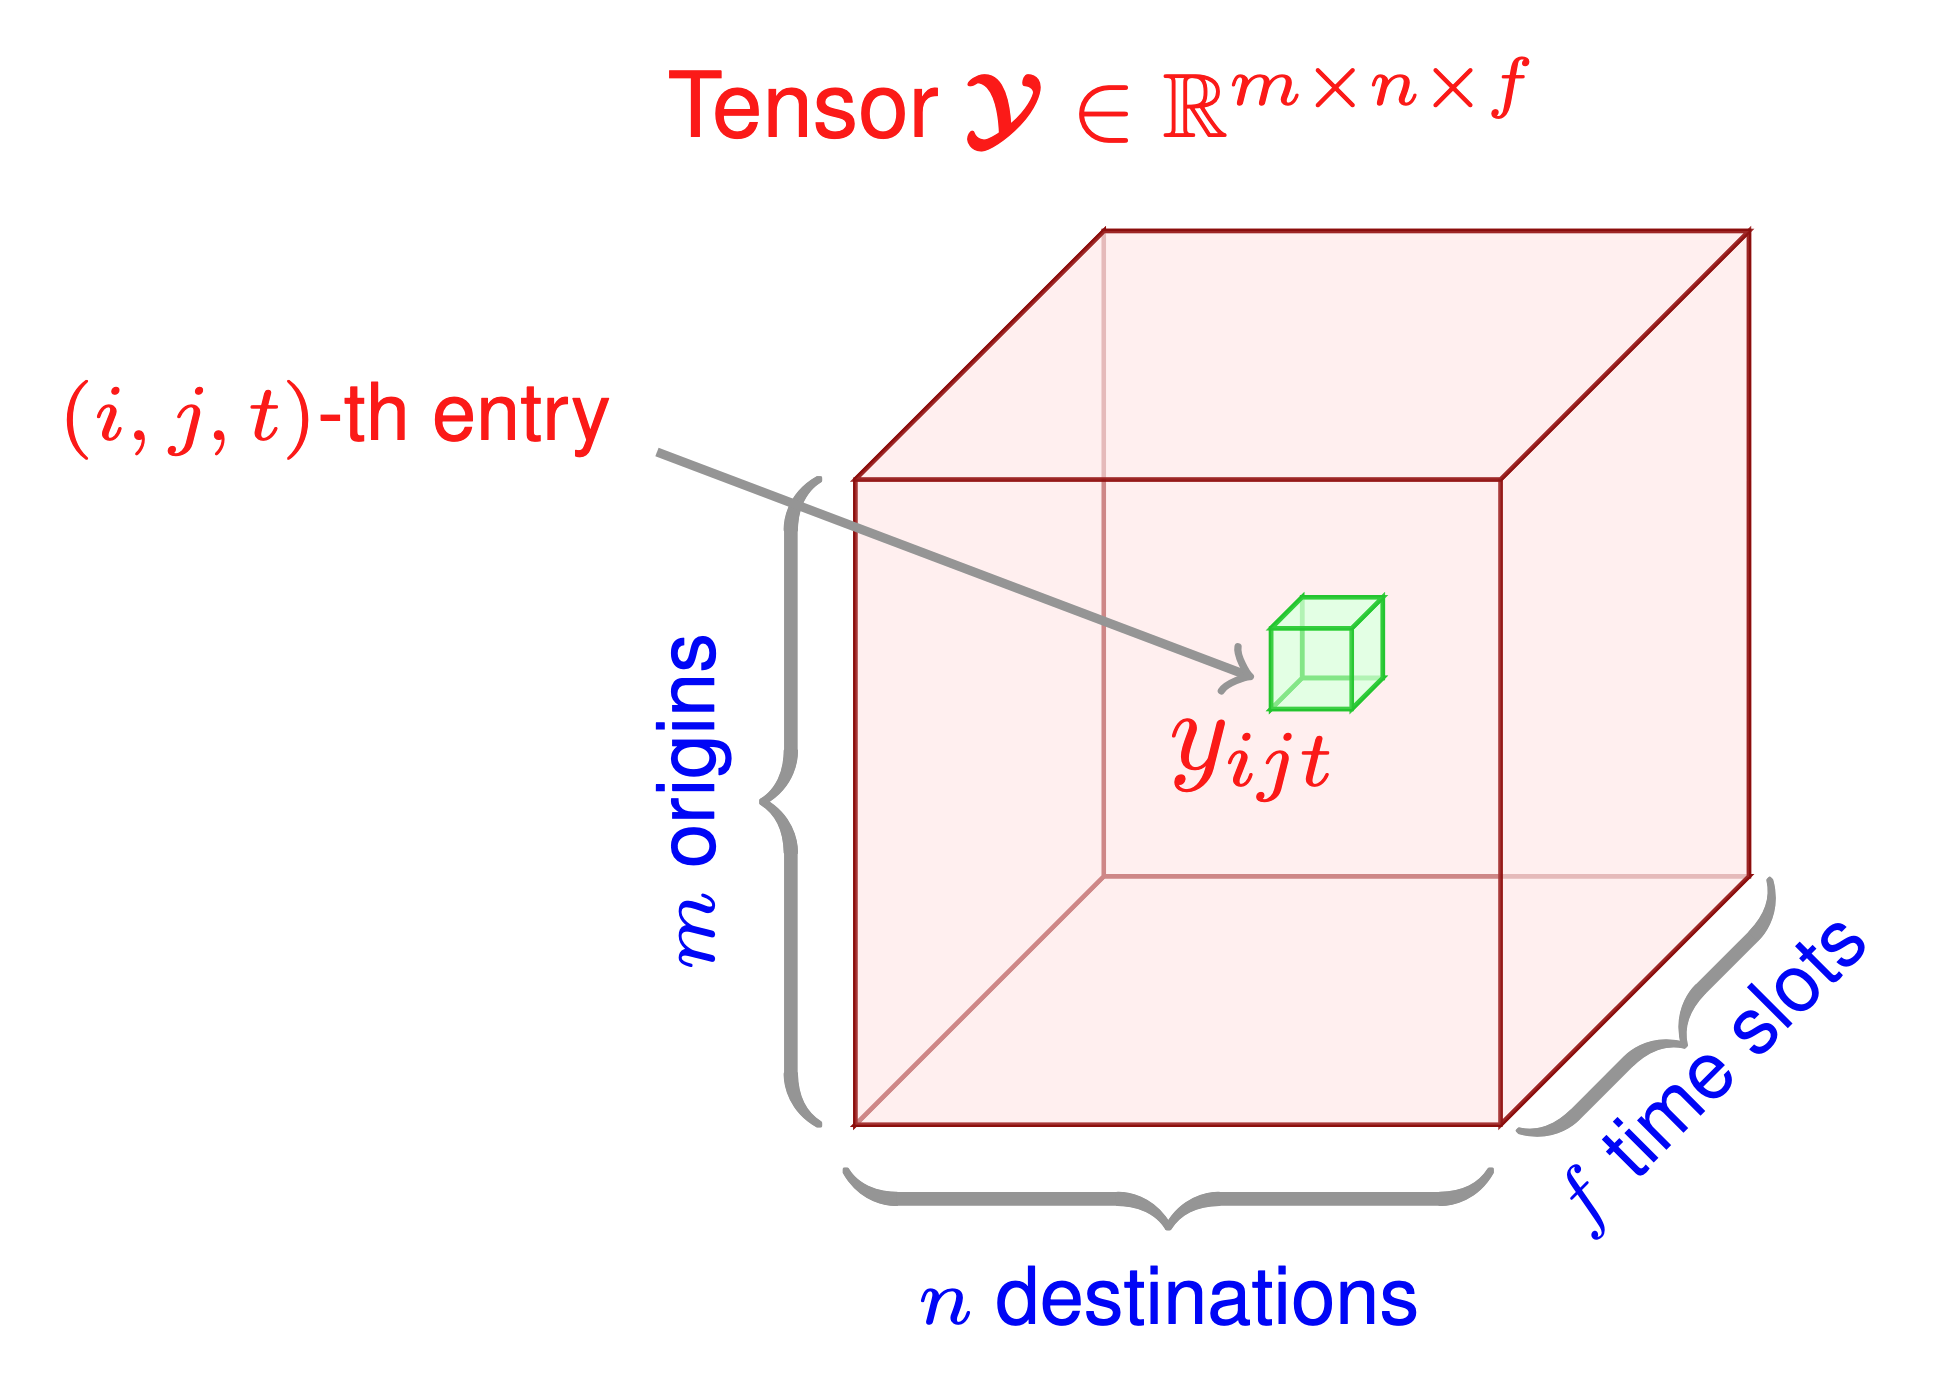
Figure 6. Illustration of a third-order tensor with multiple dimensions such as origin, destination, and time slot. See LaTeX code on GitHub.
Example 7 (Graphical model of time series autoregression).
Relevant Publications
- Xinyu Chen, HanQin Cai, Fuqiang Liu, Jinhua Zhao (2025). Correlating time series with interpretable convolutional kernels. IEEE Transactions on Knowledge and Data Engineering. [DOI]
- Xinyu Chen, Chengyuan Zhang, Xi-Le Zhao, Nicolas Saunier, Lijun Sun (2025). Forecasting sparse movement speed of urban road networks with nonstationary temporal matrix factorization. Transportation Science. [DOI]
- Xinyu Chen, Xi-Le Zhao, Chun Cheng (2024). Forecasting urban traffic states with sparse data using Hankel temporal matrix factorization. INFORMS Journal on Computing. [DOI]
- Xinyu Chen, Zhanhong Cheng, HanQin Cai, Nicolas Saunier, Lijun Sun (2024). Laplacian convolutional representation for traffic time series imputation. IEEE Transactions on Knowledge and Data Engineering. 36 (11): 6490-6502. [DOI]
- Xinyu Chen, Chengyuan Zhang, Xiaoxu Chen, Nicolas Saunier, Lijun Sun (2024). Discovering dynamic patterns from spatiotemporal data with time-varying low-rank autoregression. IEEE Transactions on Knowledge and Data Engineering. 36 (2): 504-517. [DOI]
- Xinyu Chen, Lijun Sun (2022). Bayesian temporal factorization for multidimensional time series prediction. IEEE Transactions on Pattern Analysis and Machine Intelligence. 44 (9): 4659-4673. [DOI]
(Posted by Xinyu Chen on April 17, 2025)